Still going through the Getting and Cleaning Data course on Coursera while also enrolling in the Data Manipulation using dplyr course on DataCamp. That said, i guess working on a teeny data exploration task on actual raw data would help in remembering all these new functions.
The data I’ve used is the “full version” of the Research Release file compiled by AidData. The zip file was about 180MB in size, and about 600MB when extracted. Dimensions of the csv file were 44,210 rows by 99 columns. Data is from 1946 to 2013.
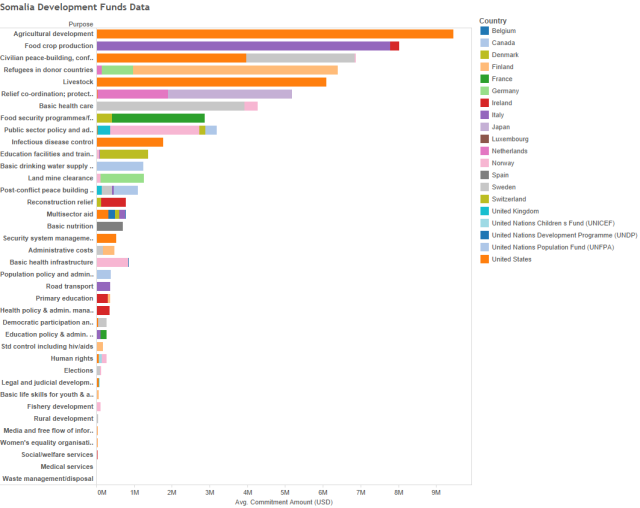
What I was curious to find out was which country contributed the most to each development/assistance category, that was shown in the file; and where Somalia was the recipient. The categories that were excluded were emergency relief funds, and emergency food aid.
I couldn’t find out the units used in the funds commitments variable, and so i’ve shown the data as they were shown in the file. Having said that, and after skimming through the data a bit, i find it a little difficult to believe that these figures are not units of 1,000 (if not 1,000,000). What i can say however is that the amounts are converted to USD and discounted to present day dollars; as of the day of the file’s publication. You can get more information about the data file from AidData’s website.
Started off with picking only the columns i needed, and then subsetted the data by selecting only ones where Somalia was a recipient.There were some funds where the purpose of the funds where not declared, and so purpose of those funds were labeled as “UNDISCLOSED” in the purpose column. This was done using a simple loop.
The second task, also done with a loop, was to create a list of data frames; each data frame containing data summarized by each donor country, and summations done on the funds, for each purpose category.
The last loop row binds all the data frames that were contained in the list generated and assigns it to a variable “e”; which is our final dataset. There were a few NA rows that were naturally generated because of the UNDISCLOSED observations, however those are then removed from the final data frame.
Here’s the code i ran to come up with the final data frame. The code assumes the data is already imported and named “aid”.You’ll have to excuse me, as the code is pretty sloppy…
library(dplyr)

#Exclude columns that are not needed..
aid_sub = select(aid, year, donor, donor_type, recipient, crs_purpose_name, commitment_amount_usd_constant)
#...filter data where the recipient is Somalia
aid_sub_som = subset(aid_sub, recipient == "Somalia")

#aid where the purpose is not available is labeled as UNDISCLOSED
x = aid_sub_som$crs_purpose_name
for(i in 1:length(x)){
if(x[i] == ""){x[i] = "UNDISCLOSED"}
}
aid_sub_som$crs_purpose_name = x

aid_sub_som = aid_sub_som[,5:6]

#to create a list of dataframes that hold all the summarised data
uDonor = unique(aid_sub_som$donor)
a = list()
for(i in 1:length(uDonor)){
x = subset(aid_sub_som, donor == uDonor[i])
b = x$donor
y = summarise_each(group_by(x[,5:6], crs_purpose_name), funs(sum))
len = length(y)
b = b[len]
y = cbind(b, y)
y[,1] = as.character(y[,1])
a[[i]] = y
}

#to deconstruct the list of dataframes and bind them to one dataframe
e = data.frame()
for(i in 1:length(a)){
c = data.frame(a[[i]])
d = data.frame(a[[i+1]])
e = rbind(e,c,d)
if(i+1 == length(a)){break}
}
…and here’s the final output after having plotted it on Tableau.
Notable observations are:
- The United States and Italy seem to be in the forefront in the area of agricultural development, food crop production, and livestock related assistance.
- With almost $4M in funds, Sweden has provided the most in basic healthcare and, along with the US, also in Civilian peace building and conflict resolution with $2.8M.
- Among the donor countries who have refugees situated with them, Finland has contributed the most spending almost $5.5M over the period.
- Japan and the Netherlands seem to have assisted highest in the category of Relief coordination and support services.
- It is interesting to see that Norway has focused assistance mainly in the areas of public sector policy and administration $2.3M, and basic health infrastructure $1M. While Canada has contributed basic drinking water supply and sanitation $1.2M.
There is one very notable exception, the United Arab Emirates, who have supplied with somewhere in the range of $10M in funds. However the aid was provided in the 1980s and not categorized, and so they were removed from the table, for the sake of the analysis.

You must be logged in to post a comment.